


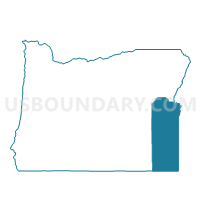
Census Tract 9709, Malheur County, Oregon
About
Outline

Summary
| Unique Area Identifier | 486438 |
| Name | Census Tract 9709 |
| County | Malheur County |
| State | Oregon |
| Area (square miles) | 9,527.71 |
| Land Area (square miles) | 9,489.73 |
| Water Area (square miles) | 37.98 |
| % of Land Area | 99.60 |
| % of Water Area | 0.40 |
| Latitude of the Internal Point | 43.16421180 |
| Longtitude of the Internal Point | -117.62100090 |
| Total Population | 5,899 |
| Total Housing Units | 1,594 |
| Total Households | 1,208 |
| Median Age | 39.9 |
Maps

Graphs
Select a template below for downloading or customizing gragh for Census Tract 9709, Malheur County, Oregon


Neighbors
Neighoring Census Tract (by Name) Neighboring Census Tract on the Map
- Census Tract 105, Humboldt County, NV
- Census Tract 9400, Malheur County, OR
- Census Tract 9501, Baker County, OR
- Census Tract 9502, Owyhee County, ID
- Census Tract 9503, Baker County, OR
- Census Tract 9601, Payette County, ID
- Census Tract 9601, Grant County, OR
- Census Tract 9602, Payette County, ID
- Census Tract 9602, Harney County, OR
- Census Tract 9702, Malheur County, OR
- Census Tract 9702, Washington County, ID
- Census Tract 9703, Washington County, ID
- Census Tract 9705, Malheur County, OR
- Census Tract 9706, Malheur County, OR
- Census Tract 9707, Malheur County, OR
Top 10 Neighboring County Subdivision (by Population) Neighboring County Subdivision on the Map
- Ontario CCD, Malheur County, OR (14,095)
- Payette CCD, Payette County, ID (9,837)
- Weiser CCD, Washington County, ID (8,543)
- Nyssa CCD, Malheur County, OR (4,436)
- Vale CCD, Malheur County, OR (4,098)
- Brogan CCD, Malheur County, OR (3,630)
- Murphy CCD, Owyhee County, ID (1,634)
- Drewsey CCD, Harney County, OR (1,468)
- Dead Ox Flat CCD, Malheur County, OR (1,439)
- Prairie City CCD, Grant County, OR (1,369)
Top 10 Neighboring Place (by Population) Neighboring Place on the Map
- Fort McDermitt CDP, NV (341)
- Annex CDP, OR (235)
- Jordan Valley city, OR (181)
- McDermitt CDP, NV (172)
- Harper CDP, OR (109)
- Brogan CDP, OR (90)
- Juntura CDP, OR (57)
Top 10 Neighboring Elementary School District (by Population) Neighboring Elementary School District on the Map
- Harney County School District 4, OR (803)
- South Harney School District 33, OR (165)
- Drewsey School District 13, OR (124)
- Juntura School District 12, OR (119)
- Diamond School District 7, OR (91)
Top 10 Neighboring Secondary School District (by Population) Neighboring Secondary School District on the Map
Top 10 Neighboring Unified School District (by Population) Neighboring Unified School District on the Map
- Ontario School District 8, OR (18,590)
- Humboldt County School District, NV (16,528)
- Payette Joint School District 371, ID (9,962)
- Weiser School District 431, ID (8,470)
- Homedale Joint School District 370, ID (5,710)
- Nyssa School District 26, OR (5,039)
- Vale School District 84, OR (4,840)
- Marsing Joint School District 363, ID (4,351)
- Adrian School District 61, OR (1,252)
- Prairie City School District 4, OR (1,209)
Top 10 Neighboring State Legislative District Lower Chamber (by Population) Neighboring State Legislative District Lower Chamber on the Map
- State House District 60, OR (55,458)
- Assembly District 33, NV (51,407)
- State House District 23, ID (45,710)
- State House District 9, ID (38,220)
Top 10 Neighboring State Legislative District Upper Chamber (by Population) Neighboring State Legislative District Upper Chamber on the Map
- State Senate District 30, OR (115,913)
- Rural Nevada Senatorial District, NV (97,335)
- State Senate District 23, ID (45,710)
- State Senate District 9, ID (38,220)
Top 10 Neighboring 111th Congressional District (by Population) Neighboring 111th Congressional District on the Map
- Congressional District 1, ID (841,930)
- Congressional District 2, NV (836,562)
- Congressional District 2, OR (769,987)
Top 10 Neighboring 5-Digit ZIP Code Tabulation Area (by Population) Neighboring 5-Digit ZIP Code Tabulation Area on the Map
- 97914, OR (19,205)
- 83661, ID (9,881)
- 83672, ID (8,583)
- 97913, OR (5,531)
- 97918, OR (4,537)
- 83628, ID (4,329)
- 97901, OR (692)
- 97910, OR (641)
- 89421, OR (634)
- 97907, OR (560)
Data
Demographic, Population, Households, and Housing Units
** Data sources from census 2010 **
Show Data on Map
Download Full List as CSV
Download Quick Sheet as CSV
| Subject | This Area | Malheur County | Oregon | National |
|---|---|---|---|---|
| POPULATION | ||||
| Total Population Map | 5,899 | 31,313 | 3,831,074 | 308,745,538 |
| POPULATION, HISPANIC OR LATINO ORIGIN | ||||
| Not Hispanic or Latino Map | 4,975 | 21,446 | 3,381,012 | 258,267,944 |
| Hispanic or Latino Map | 924 | 9,867 | 450,062 | 50,477,594 |
| POPULATION, RACE | ||||
| White alone Map | 5,110 | 24,272 | 3,204,614 | 223,553,265 |
| Black or African American alone Map | 262 | 370 | 69,206 | 38,929,319 |
| American Indian and Alaska Native alone Map | 87 | 364 | 53,203 | 2,932,248 |
| Asian alone Map | 89 | 527 | 141,263 | 14,674,252 |
| Native Hawaiian and Other Pacific Islander alone Map | 7 | 30 | 13,404 | 540,013 |
| Some Other Race alone Map | 258 | 4,849 | 204,625 | 19,107,368 |
| Two or More Races Map | 86 | 901 | 144,759 | 9,009,073 |
| POPULATION, SEX | ||||
| Male Map | 4,442 | 16,926 | 1,896,002 | 151,781,326 |
| Female Map | 1,457 | 14,387 | 1,935,072 | 156,964,212 |
| POPULATION, AGE (18 YEARS) | ||||
| 18 years and over Map | 5,216 | 23,309 | 2,964,621 | 234,564,071 |
| Under 18 years | 683 | 8,004 | 866,453 | 74,181,467 |
| POPULATION, AGE | ||||
| Under 5 years | 179 | 2,311 | 237,556 | 20,201,362 |
| 5 to 9 years | 191 | 2,202 | 237,214 | 20,348,657 |
| 10 to 14 years | 191 | 2,177 | 242,553 | 20,677,194 |
| 15 to 17 years | 122 | 1,314 | 149,130 | 12,954,254 |
| 18 and 19 years | 89 | 975 | 105,730 | 9,086,089 |
| 20 years | 86 | 475 | 52,462 | 4,519,129 |
| 21 years | 97 | 409 | 50,575 | 4,354,294 |
| 22 to 24 years | 307 | 1,224 | 150,011 | 12,712,576 |
| 25 to 29 years | 594 | 2,095 | 265,033 | 21,101,849 |
| 30 to 34 years | 603 | 2,051 | 259,111 | 19,962,099 |
| 35 to 39 years | 500 | 1,910 | 251,163 | 20,179,642 |
| 40 to 44 years | 527 | 1,905 | 248,362 | 20,890,964 |
| 45 to 49 years | 554 | 2,001 | 262,879 | 22,708,591 |
| 50 to 54 years | 458 | 1,998 | 276,196 | 22,298,125 |
| 55 to 59 years | 391 | 1,928 | 273,423 | 19,664,805 |
| 60 and 61 years | 139 | 681 | 100,551 | 7,113,727 |
| 62 to 64 years | 162 | 963 | 135,592 | 9,704,197 |
| 65 and 66 years | 107 | 581 | 73,650 | 5,319,902 |
| 67 to 69 years | 165 | 810 | 96,197 | 7,115,361 |
| 70 to 74 years | 184 | 1,099 | 120,194 | 9,278,166 |
| 75 to 79 years | 125 | 847 | 91,601 | 7,317,795 |
| 80 to 84 years | 69 | 630 | 74,019 | 5,743,327 |
| 85 years and over | 59 | 727 | 77,872 | 5,493,433 |
| MEDIAN AGE BY SEX | ||||
| Both sexes Map | 39.90 | 36.20 | 38.40 | 37.20 |
| Male Map | 38.70 | 35.60 | 37.30 | 35.80 |
| Female Map | 46.30 | 37.00 | 39.50 | 38.50 |
| HOUSEHOLDS | ||||
| Total Households Map | 1,208 | 10,411 | 1,518,938 | 116,716,292 |
| HOUSEHOLDS, HOUSEHOLD TYPE | ||||
| Family households: Map | 853 | 7,149 | 963,467 | 77,538,296 |
| Husband-wife family Map | 733 | 5,377 | 733,741 | 56,510,377 |
| Other family: Map | 120 | 1,772 | 229,726 | 21,027,919 |
| Male householder, no wife present Map | 47 | 544 | 70,921 | 5,777,570 |
| Female householder, no husband present Map | 73 | 1,228 | 158,805 | 15,250,349 |
| Nonfamily households: Map | 355 | 3,262 | 555,471 | 39,177,996 |
| Householder living alone Map | 295 | 2,709 | 416,747 | 31,204,909 |
| Householder not living alone Map | 60 | 553 | 138,724 | 7,973,087 |
| HOUSEHOLDS, HISPANIC OR LATINO ORIGIN OF HOUSEHOLDER | ||||
| Not Hispanic or Latino householder: Map | 1,114 | 8,027 | 1,409,055 | 103,254,926 |
| Hispanic or Latino householder: Map | 94 | 2,384 | 109,883 | 13,461,366 |
| HOUSEHOLDS, RACE OF HOUSEHOLDER | ||||
| Householder who is White alone | 1,103 | 8,550 | 1,339,740 | 89,754,352 |
| Householder who is Black or African American alone | 3 | 36 | 24,638 | 14,129,983 |
| Householder who is American Indian and Alaska Native alone | 11 | 97 | 17,811 | 939,707 |
| Householder who is Asian alone | 25 | 247 | 45,466 | 4,632,164 |
| Householder who is Native Hawaiian and Other Pacific Islander alone | 2 | 8 | 3,647 | 143,932 |
| Householder who is Some Other Race alone | 43 | 1,258 | 50,154 | 4,916,427 |
| Householder who is Two or More Races | 21 | 215 | 37,482 | 2,199,727 |
| HOUSEHOLDS, HOUSEHOLD TYPE BY HOUSEHOLD SIZE | ||||
| Family households: Map | 853 | 7,149 | 963,467 | 77,538,296 |
| 2-person household Map | 458 | 3,048 | 438,909 | 31,882,616 |
| 3-person household Map | 153 | 1,413 | 211,114 | 17,765,829 |
| 4-person household Map | 132 | 1,175 | 175,719 | 15,214,075 |
| 5-person household Map | 58 | 773 | 81,168 | 7,411,997 |
| 6-person household Map | 28 | 408 | 33,409 | 3,026,278 |
| 7-or-more-person household Map | 24 | 332 | 23,148 | 2,237,501 |
| Nonfamily households: Map | 355 | 3,262 | 555,471 | 39,177,996 |
| 1-person household Map | 295 | 2,709 | 416,747 | 31,204,909 |
| 2-person household Map | 53 | 443 | 109,435 | 6,360,012 |
| 3-person household Map | 5 | 66 | 18,159 | 992,156 |
| 4-person household Map | 2 | 28 | 7,031 | 411,171 |
| 5-person household Map | 0 | 14 | 2,621 | 126,634 |
| 6-person household Map | 0 | 2 | 920 | 48,421 |
| 7-or-more-person household Map | 0 | 0 | 558 | 34,693 |
| HOUSING UNITS | ||||
| Total Housing Units Map | 1,594 | 11,692 | 1,675,562 | 131,704,730 |
| HOUSING UNITS, OCCUPANCY STATUS | ||||
| Occupied Map | 1,208 | 10,411 | 1,518,938 | 116,716,292 |
| Vacant Map | 386 | 1,281 | 156,624 | 14,988,438 |
| HOUSING UNITS, OCCUPIED, TENURE | ||||
| Owned with a mortgage or a loan Map | 397 | 3,862 | 678,120 | 52,979,430 |
| Owned free and clear Map | 427 | 2,639 | 266,365 | 23,006,644 |
| Renter occupied Map | 384 | 3,910 | 574,453 | 40,730,218 |
| HOUSING UNITS, VACANT, VACANCY STATUS | ||||
| For rent Map | 34 | 297 | 40,193 | 4,137,567 |
| Rented, not occupied Map | 1 | 31 | 2,608 | 206,825 |
| For sale only Map | 13 | 139 | 24,191 | 1,896,796 |
| Sold, not occupied Map | 14 | 48 | 4,401 | 421,032 |
| For seasonal, recreational, or occasional use Map | 209 | 303 | 55,473 | 4,649,298 |
| For migrant workers Map | 18 | 30 | 461 | 24,161 |
| Other vacant Map | 97 | 433 | 29,297 | 3,652,759 |
| HOUSING UNITS, OCCUPIED, AVERAGE HOUSEHOLD SIZE BY TENURE | ||||
| Total: Map | 2.46 | 2.69 | 2.47 | 2.58 |
| Owner occupied Map | 2.38 | 2.71 | 2.53 | 2.65 |
| Renter occupied Map | 2.64 | 2.64 | 2.36 | 2.44 |
| HOUSING UNITS, OCCUPIED, TENURE BY RACE OF HOUSEHOLDER | ||||
| Owner occupied: Map | 824 | 6,501 | 944,485 | 75,986,074 |
| Householder who is White alone Map | 775 | 5,591 | 862,700 | 63,446,275 |
| Householder who is Black or African American alone Map | 1 | 6 | 8,106 | 6,261,464 |
| Householder who is American Indian and Alaska Native alone Map | 5 | 39 | 8,471 | 509,588 |
| Householder who is Asian alone Map | 20 | 184 | 28,280 | 2,688,861 |
| Householder who is Native Hawaiian and Other Pacific Islander alone Map | 0 | 1 | 1,196 | 61,911 |
| Householder who is Some Other Race alone Map | 10 | 570 | 18,640 | 1,975,817 |
| Householder who is Two or More Races Map | 13 | 110 | 17,092 | 1,042,158 |
| Renter occupied: Map | 384 | 3,910 | 574,453 | 40,730,218 |
| Householder who is White alone Map | 328 | 2,959 | 477,040 | 26,308,077 |
| Householder who is Black or African American alone Map | 2 | 30 | 16,532 | 7,868,519 |
| Householder who is American Indian and Alaska Native alone Map | 6 | 58 | 9,340 | 430,119 |
| Householder who is Asian alone Map | 5 | 63 | 17,186 | 1,943,303 |
| Householder who is Native Hawaiian and Other Pacific Islander alone Map | 2 | 7 | 2,451 | 82,021 |
| Householder who is Some Other Race alone Map | 33 | 688 | 31,514 | 2,940,610 |
| Householder who is Two or More Races Map | 8 | 105 | 20,390 | 1,157,569 |
| HOUSING UNITS, OCCUPIED, TENURE BY HISPANIC OR LATINO ORIGIN OF HOUSEHOLDER | ||||
| Owner occupied: Map | 824 | 6,501 | 944,485 | 75,986,074 |
| Not Hispanic or Latino householder Map | 788 | 5,379 | 900,276 | 69,617,625 |
| Hispanic or Latino householder Map | 36 | 1,122 | 44,209 | 6,368,449 |
| Renter occupied: Map | 384 | 3,910 | 574,453 | 40,730,218 |
| Not Hispanic or Latino householder Map | 326 | 2,648 | 508,779 | 33,637,301 |
| Hispanic or Latino householder Map | 58 | 1,262 | 65,674 | 7,092,917 |
| HOUSING UNITS, OCCUPIED, TENURE BY HOUSEHOLD SIZE | ||||
| Owner occupied: Map | 824 | 6,501 | 944,485 | 75,986,074 |
| 1-person household Map | 179 | 1,338 | 205,782 | 16,453,569 |
| 2-person household Map | 409 | 2,598 | 387,395 | 27,618,605 |
| 3-person household Map | 93 | 902 | 144,798 | 12,517,563 |
| 4-person household Map | 82 | 740 | 121,269 | 10,998,793 |
| 5-person household Map | 36 | 482 | 51,153 | 5,057,765 |
| 6-person household Map | 13 | 245 | 20,219 | 1,965,796 |
| 7-or-more-person household Map | 12 | 196 | 13,869 | 1,373,983 |
| Renter occupied: Map | 384 | 3,910 | 574,453 | 40,730,218 |
| 1-person household Map | 116 | 1,371 | 210,965 | 14,751,340 |
| 2-person household Map | 102 | 893 | 160,949 | 10,624,023 |
| 3-person household Map | 65 | 577 | 84,475 | 6,240,422 |
| 4-person household Map | 52 | 463 | 61,481 | 4,626,453 |
| 5-person household Map | 22 | 305 | 32,636 | 2,480,866 |
| 6-person household Map | 15 | 165 | 14,110 | 1,108,903 |
| 7-or-more-person household Map | 12 | 136 | 9,837 | 898,211 |
Loading...